Improve the performance of Mapbox GL JS maps
Model of performance
The performance of your Mapbox GL JS maps can be measured as render time, source update time, or layer update time.
Render time
The render time refers to how quickly Mapbox GL JS draws a map on your screen as you move around or zoom in and out of the map. Render time is a function of the number of sources, the number of layers, and the number of vertices in the features they contain:
render time = constant time + [ number of sources * per source time ] + [ number of layers * per layer time ] + [ number of vertices * per vertex time ]
Source update time
The source update time refers to how quickly changes to a GeoJSON source are visible on the map. Source update time is a function of the number of layers that use the updated source and the number of vertices in the features it contains:
source update time = constant time + [ number of layers using the source * per layer time ] + [ number of vertices * per vertex time ]
Layer update time
The layer update time refers to how quickly changes to a layer, using runtime styling, are visible on the map. Layer update time is a function of the number of vertices in the features the layer contains:
layer update time = constant time + [ # of vertices in the layer's source * per vertex time ]
Strategies for improving performance
When looking for opportunities to improve the performance of your map, look for ways in which you can reduce the number of layers, number of sources, or the complexity of the features in the data that is being rendered.
Combine layers
Combining layers that use similar styles or that can be styled using data-driven styling will reduce the number of layers, in turn reducing the render time. This strategy works well for layers with many features of the same type (fill, line, circle, symbol, or fill-extrusion) that are either styled similarly or whose styles vary by the value of a specific data field. For more on data-driven styling see the Map design guide and our Graduated circle map tutorial with Mapbox GL JS data-driven styles tutorial.
Use vector tileset sources
Use vector tileset sources over GeoJSON data sources when possible. The renderer splits features in vector tilesets into tiles which allows GL JS to load only the features that are visible on the map. Feature geometries are also simplified meaning there are fewer vertices resulting in reduced render, source update, and layer update times. This strategy works well when working with large datasets that don't need to be updated quickly. You can create vector tilesets using the Mapbox Uploads API or by uploading data on the Mapbox Studio Tilesets page.
Combine vector tile sources
Combining sources will reduce the number of sources and, as a result, the render time. This strategy works well when you have data coming from many individual data files. You can combine vector tile sources by either using composited sources or by creating a single vector tileset source with multiple source layers.
If you are creating vector tilesets by uploading data to Mapbox Studio, you can create a style and add vector tileset sources using the Mapbox Studio style editor. Vector sources are composited by default in the Mapbox Studio style editor.
You can create a single vector tileset source with multiple source layers using Mapbox Tiling Service or the Tippecanoe command line tool.
Remove unused features
Only include features that are being used in the current style. This will reduce the number of vertices, in turn reducing both render time and source update time. This works well when you are using one of our template styles. You can remove unused features using style-optimized vector tiles. Style-optimized vector tiles are smaller and a way to reduce the size of offline caches. This feature of the Mapbox Vector Tiles API removes any layers or features in the tile that are not used in the style.
You can use style-optimized vector tilesets in Mapbox GL JS by adding ?optimize=true to the end of your style URL:
const map = new mapboxgl.Map({
  container: 'map',
  style: 'mapbox://styles/mapbox/outdoors-v12?optimize=true' // optimize=true
});
You should not use ?optimize=true if you plan to add any style layers at runtime that rely on a source layer that is in a tileset that is defined as a source in the style JSON, but not used in the initial style.
Say you have a style that references a tileset with four layers: campsites, mountains, forestland, and buildings. The final map includes icons for campsites, a pattern for forests, and a pattern for blue mountains, but does not use buildings. In a normal Mapbox GL map, the tiles loaded include all four layers even though they aren’t all needed. A style-optimized vector tile includes only campsites, forestland, and blue mountains. It removes unused layers and features based on attributes and zoom levels.
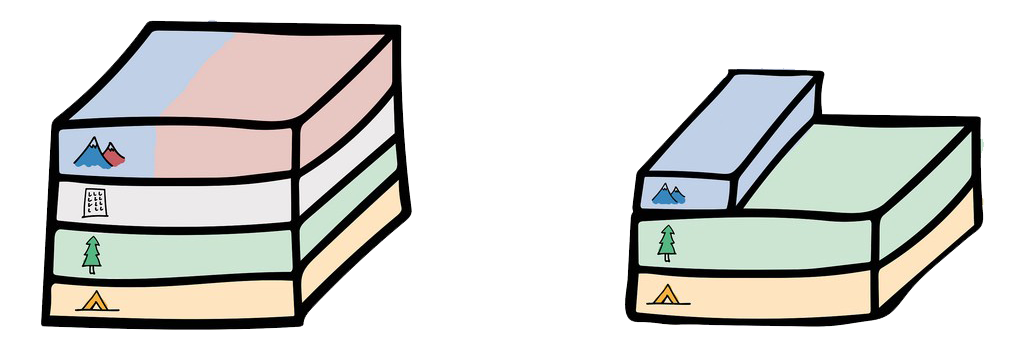
The illustration on the left is a normal vector tileset and the one on the right is a style-optimized vector tileset.
Optimize expressions
Expressions offer enormous flexibility when filtering and styling map data. There are often several ways to achieve the same visual effect with expressions, but each approach has different performance implications. There are a few guidelines for identifying the most performant expression.
Filter by zoom levels
Add explicit minzoom and maxzoom values to style layers to prevent filters from being used for evaluation at zoom levels where all geometries will be false. For example, in the Mapbox Streets style, there is a state-label layer. The data for this layer comes from the place_label source layer. Features with a class equal to state only exist at zoom levels between 3 and 9. By specifying a minzoom of 3 and a maxzoom of 9, you avoid applying the filter to many features that you already know will not have the state class.
More performant
{
  "id": "state-label",
  "type": "symbol",
  "source": "composite",
  "source-layer": "place_label",
  "minzoom": 3,
  "maxzoom": 9,
  "filter": ["==", ["get", "class"], "state"]
  /* layout and paint properties  */
}
Less performant
{
  "id": "state-label",
  "type": "symbol",
  "source": "composite",
  "source-layer": "place_label",
  "filter": ["==", ["get", "class"], "state"]
  /* layout and paint properties  */
}
Reduce the number of filters
If you find yourself applying a significant number of filters to achieve a particular result, consider making adjustments to the data. For example, splitting geometries into multiple source layers to avoid the need for complex filter expressions. You can also adjust your styling strategy. Split your styling objectives into more than one layer so you can use more precise expressions for each layer.
There are trade offs between simplifying filters using this approach and reducing layers by using data-driven expressions. Read more about reducing layers using data-driven styling above.
Make sure expressions do not produce errors
Before applying a condition to a data property, make sure the feature you are applying the condition to has that data property. The errors thrown when attempting to apply a conditional for a property that doesn't exist can have a significant effect on performance. For example, the Mapbox Streets style uses the all expression to filter the roads source layer to display highway shields. This expression first checks if a feature in the source layer has a particular property (reflen), then filters all features that do have the reflen property for those that are less than or equal to six.
More performant
"filter": [
  "all",
  ["has", "reflen"],
  [ "<=", [ "get", "reflen" ], 6 ],
  [ "step",
    [ "zoom" ],
    [
      "==",
      [ "geometry-type" ],
      "Point"
    ],
    11,
    [ ">", [ "get", "len" ], 5000 ],
    12,
    [ ">", [ "get", "len" ], 2500 ],
    13,
    [ ">", [ "get", "len" ], 1000 ],
    14,
    true
  ]
]
Less performant
"filter": [
  "all",
  /* no `has` expression */
  [ "<=", [ "get", "reflen" ], 6 ],
  [ "step",
    [ "zoom" ],
    [
      "==",
      [ "geometry-type" ],
      "Point"
    ],
    11,
    [ ">", [ "get", "len" ], 5000 ],
    12,
    [ ">", [ "get", "len" ], 2500 ],
    13,
    [ ">", [ "get", "len" ], 1000 ],
    14,
    true
  ]
]
Order filter conditions from more specific to less specific
This will reduce number of geometries going through the next nested filter. Below is another example from the Mapbox Streets style. The Mapbox Streets style includes several tunnel layers. Data used for tunnel layers comes from the road source layer. The road source layer includes many features that are not tunnels. The expression below is used to filter the road source layer for the tunnel-primary-secondary-tertiary style layer:
-
First it narrows from all road features to only features where
structureis equal totunnel. -
Then, it filters those tunnel features to only include features with
primary,secondary, ortertiaryclasses. This condition is less specific than the first condition. In the entireroadsource layer, there are far more features with aclassofprimary,secondary, ortertiarythan there are features wherestructureis equal totunnel. -
Finally, it filters those primary, secondary, and tertiary tunnel features to only include lines (not, for example, labels). This condition is less specific than the first two conditions. In the entire
roadsource layer, there are far more features that are lines than there are features with theclassorstructurelisted above.
More performant
"filter": [
  "all",
  [
    "==",
    [ "get", "structure" ],
    "tunnel"
  ],
  [ "match",
    [ "get", "class" ],
    [ "primary", "secondary", "tertiary" ],
    true,
    false
  ],
  [
    "==",
    [ "geometry-type" ],
    "LineString"
  ]
]
Less performant
"filter": [
  "all",
  [
    "==",
    [ "geometry-type" ],
    "LineString"
  ],
  [
    "match",
    [ "get", "class" ],
    [ "primary", "secondary", "tertiary" ],
    true,
    false
  ]
  [
    "match",
    [ "get", "structure" ],
    "tunnel",
    true,
    false
  ]
]
Simplify expressions
The simpler a filter or expression is, the better. For example, ["==", ["get", "foo"], "bar"] is simpler than ["match", ["get", "foo"], "bar", true, false]. The match expression is implemented differently than the == expression. It builds a lookup object for matching, and while looking up objects in JS is fast, it is still slower than a simple comparison (which adds up if you do hundreds of thousands of matches for large amounts of data).
More performant
["==", ["get", "structure"], "tunnel"]
Less performant
["match", ["get", "structure"], "tunnel", true, false]
Like match, the case and step expressions can also be simplified when they don't include multiple branches.
Style denser features first
It's common to group features (for example, landuse) into a single layer and use a data expression on paint properties to differentiate between them. Reorder dense or more visible data so their draw order is prioritized. In the example below, features with the shadow class are more visible than features with the highlight class. To optimize performance, assign a fill-color to shadow features first and highlight features will be assigned the fallback value.
More performant
"fill-color": [
  "match",
  ["get", "class"],
  "shadow",
  "hsl(56, 59%, 22%)",
  "hsl(0, 0%, 100%)"
]
Less performant
"fill-color": [
  "match",
  ["get", "class"],
  "highlight",
  "hsl(0, 0%, 100%)",
  "hsl(56, 59%, 22%)"
]
Use a separate GeoJSON source for data that needs to be updated rapidly
When using a GeoJSON source, any update to it requires Mapbox GL JS to reprocess the entire set of data. If updates must happen quickly and only ever affect a small number of features in a GeoJSON source (for example, changing a few features' property values or moving a single point's location), it may be beneficial to use two sources instead: one with the full, large dataset, used by layers that don't update, and a second one containing only the dynamic, or updated, features used by layers that are specifically showing those features. That way, when you update the dynamic source, you're only reprocessing a small number of features.
If you have a large dataset with many features, and you want to create a hover effect for a single point at a time, you can use one large source for the regular features and a separate source with only one feature and the hover styles to improve update times.
You can find additional tips on our Working with large GeoJSON sources in Mapbox GL JS troubleshooting guide.
Use feature state
Updating data is costly and can negatively impact performance. The feature-state expression allows you to insert new data into a feature at runtime, which will reduce the layer update time. When you need to make hover or selected styles for map features, use the map.setFeatureState method to avoid re-parsing all the geometries at each state change. Note that feature-state can only be used with paint properties that support data-driven styling.
Similar layers
Layers with matching properties type, source, source-layer, zoom, filter and layout are automatically grouped and rendered faster. For example, you could use a second water layer to create dimension, and because all properties except for those defined in paint are shared they qualify to be grouped and will render faster. Find opportunities for layers that may qualify to be grouped, and make sure they use the same type, source, source-layer, zoom, filter and layout to be grouped and rendered faster.
{
  "id": "water",
  "type": "fill",
  "layout": {},
  "paint": {
    "fill-color": "blue"
  }
},
{
  "id": "water",
  "type": "fill",
  "layout": {},
  "paint": {
    "fill-color": "navy",
    "fill-translate": ["literal", [-1, -1]]
  }
}