Install in Dash
 Data-Driven Styling Reference
Data-Driven Styling
Mapbox’s data-driven styling features allow you to use data properties to style your maps. You can style map features automatically based on their individual attributes.
Vary POI icons, transit route line colors, city polygon opacity, and more based on any attribute in your data. Need to visualize hotel data by price? You can have your map’s point radii and colors change automatically with your data.
How to use Data-Driven Styling
This guide uses earthquake data from the U.S. Geological Survey to style a map based on attributes. For more information about how to work with GeoJSON data in our iOS SDK, please see our working with GeoJSON data guide.
MGLStyleFunction
There are three subclasses of MGLStyleFunction:
MGLCameraStyleFunction- For a style value that changes with zoom level. For example, you can make the radius of a circle increase according to zoom level.MGLSourceStyleFunction- For a style value that changes with the attributes of a feature. For example, you can adjust the radius of a circle based on the magnitude of an earthquake.MGLCompositeStyleFunction- For a style value that changes with both zoom level and attribute values. For example, you can add a circle layer where each circle has a radius based on both zoom level and the magnitude of an earthquake.
The documentation for individual style properties will note which style functions are enabled for that property.
Stops
Stops are key-value pairs that that determine a style value. With a MGLCameraSourceFunction stop, you can use a dictionary with a zoom level for a key and a MGLStyleValue for the value. For example, you can use a stops dictionary with zoom levels 0, 10, and 20 as keys, and yellow, orange, and red as the values. A MGLSourceStyleFunction uses the relevant attribute value as the key.
let stops = [0: MGLStyleValue(rawValue: UIColor.yellow),
             2.5: MGLStyleValue(rawValue: UIColor.orange),
             5: MGLStyleValue(rawValue: UIColor.red),
             7.5: MGLStyleValue(rawValue: UIColor.blue),
             10: MGLStyleValue(rawValue: UIColor.white)]
Interpolation Mode
The effect a key has on the style value is determined by the interpolation mode. There are four interpolation modes that can be used with a source style function: exponential, interval, categorical, and identity. You can also use exponential and interval interpolation modes with a camera style function.
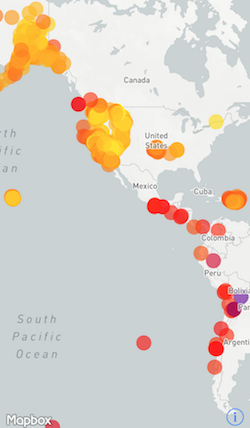
Linear
MGLInterpolationModelExponential interpolates linearly or exponentially between style function stop values. By default, the MGLStyleFunction options parameter MGLStyleFunctionOptionInterpolationBase equals 1, which represents linear interpolation, and doesn’t need to be included in the options dictionary.
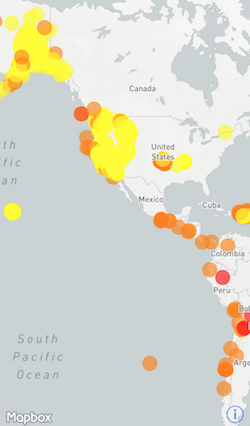
The stops dictionary below, for example, shows colors that continuously shift from yellow to orange to red to blue to white based on the attribute value.
let url = URL(string: "https://earthquake.usgs.gov/earthquakes/feed/v1.0/summary/all_week.geojson")
let symbolSource = MGLSource(identifier: "source")
let symbolLayer = MGLSymbolStyleLayer(identifier: "place-city-sm", source: symbolSource)

let source = MGLShapeSource(identifier: "earthquakes", url: url, options: nil)
style.addSource(source)

let stops = [0: MGLStyleValue(rawValue: UIColor.yellow),
             2.5: MGLStyleValue(rawValue: UIColor.orange),
             5: MGLStyleValue(rawValue: UIColor.red),
             7.5: MGLStyleValue(rawValue: UIColor.blue),
             10: MGLStyleValue(rawValue: UIColor.white)]

let layer = MGLCircleStyleLayer(identifier: "circles", source: source)
layer.circleColor = MGLStyleValue(interpolationMode: .exponential,
                                  sourceStops: stops,
                                  attributeName: "mag",
                                  options: [.defaultValue: MGLStyleValue<UIColor>(rawValue: .green)])
layer.circleRadius = MGLStyleValue(rawValue: 10)
style.insertLayer(layer, below: symbolLayer)
Exponential
MGLInterpolationModelExponential combined with any MGLStyleFunctionOptionInterpolationBase greater than 0, you can interpolate between values exponentially, create an accelerated ramp effect.
Here’s a visualization from Mapbox Studio (see Working with Mapbox Studio) comparing interpolation base values of 1.5 and 0.5 based on zoom.

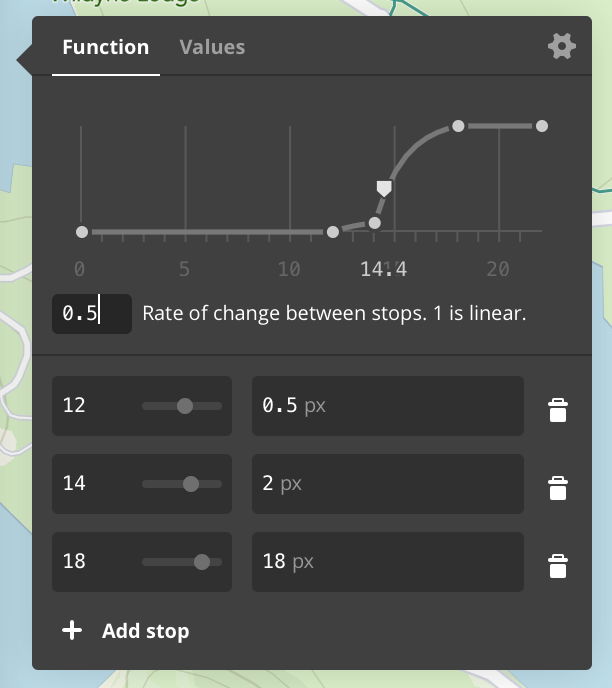
The example below increases a layer’s circleRadius exponentially based on a map’s zoom level. The MGLStyleFunctionOptionInterpolationBase is 1.5.
let stops = [12: MGLStyleValue(rawValue: 0.5),
             14: MGLStyleValue(rawValue: 2),
             18: MGLStyleValue(rawValue: 18)]

layer.circleRadius = MGLStyleValue(interpolationMode: .exponential,
                                  cameraStops: stops,
                                  options: [.interpolationBase: 1.5])
Interval
MGLInterpolationModeInterval creates a range using the keys from the stops dictionary. The range is from the given key to just less than the next key. The attribute values that fall into that range are then styled using the style value assigned to that key.
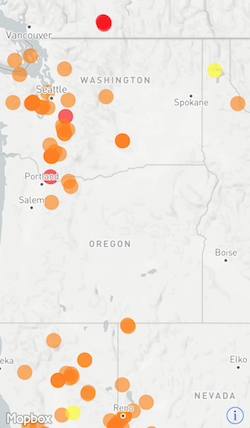
When we use the stops dictionary given above with an interval interpolation mode, we create ranges where earthquakes with a magnitude of 0 to just less than 2.5 would be yellow, 2.5 to just less than 5 would be orange, and so on.
let stops = [0: MGLStyleValue(rawValue: UIColor.yellow),
             2.5: MGLStyleValue(rawValue: UIColor.orange),
             5: MGLStyleValue(rawValue: UIColor.red),
             7.5: MGLStyleValue(rawValue: UIColor.blue),
             10: MGLStyleValue(rawValue: UIColor.white)]

layer.circleColor = MGLStyleValue(interpolationMode: .interval,
                                  sourceStops: stops,
                                  attributeName: "mag",
                                  options: [.defaultValue: MGLStyleValue<UIColor>(rawValue: .green)])
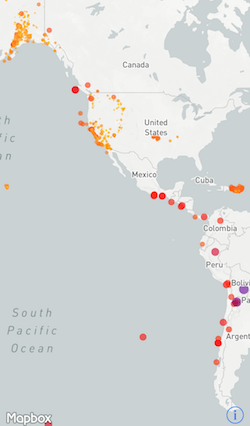
Categorical
Returns the output value that is equal to the stop for the function input. We’re going to use a different stops dictionary than we did for the previous two modes.
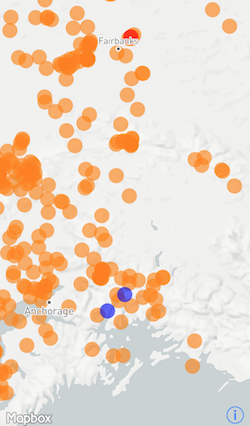
There are three main types of events in the dataset: earthquakes, explosions, and quarry blasts. In this case, the color of the circle layer will be determined by the type of event, with a default value of green to catch any events that do not fall into any of those categories.
let categoricalStops = ["earthquake": MGLStyleValue(rawValue: UIColor.orange),
                        "explosion": MGLStyleValue(rawValue: UIColor.red),
                        "quarry blast": MGLStyleValue(rawValue: UIColor.yellow)]

layer.circleColor = MGLStyleValue(interpolationMode: .categorical,
                                  sourceStops: categoricalStops,
                                  attributeName: "type",
                                  options: [.defaultValue: MGLStyleValue(rawValue: UIColor.blue)])
Identity
MGLInterpolationModeIdentity uses the attribute’s value as the style value. For example, you can set the circleRadius to the earthquake’s magnitude. Since the attribute value itself will be used as the style value, sourceStops should be set to nil.
layer.circleRadius = MGLStyleValue(interpolationMode: .identity,
                                   sourceStops: nil,
                                   attributeName: "mag",
                                   options: [.defaultValue: MGLStyleValue<NSNumber>(rawValue: 0)])